Case Study
Full Stack Observability Implementation
Unified fragmented monitoring stacks into one actionable New Relic workflow so incidents move from guesswork to fast, context-rich response.
Snapshot
Role
Observability / SRE implementation lead
Scope
Discovery, instrumentation, dashboard design, alert tuning, and engineer enablement.
Stack
Outcome
Unified fragmented monitoring into one incident response workflow with clearer ownership and faster root cause analysis.
Technical implementation
Instrumented applications, infrastructure, dashboards, and alert workflows across production environments.
Architecture decision
Consolidated fragmented telemetry into one operating model with trace-log-metric correlation and team-specific views.
Operational outcome
Reduced blind spots and helped teams move from user-reported incidents to faster, context-rich response.
The Problem
Most teams I work with aren't flying blind by choice. They're running three different monitoring tools that don't talk to each other, relying on open-source stacks nobody has time to maintain, and finding out about errors from their users before their dashboards do. Root cause analysis turns into a war room guessing game. This is the pattern I see repeatedly across fintech, manufacturing, healthcare, and ecommerce clients.
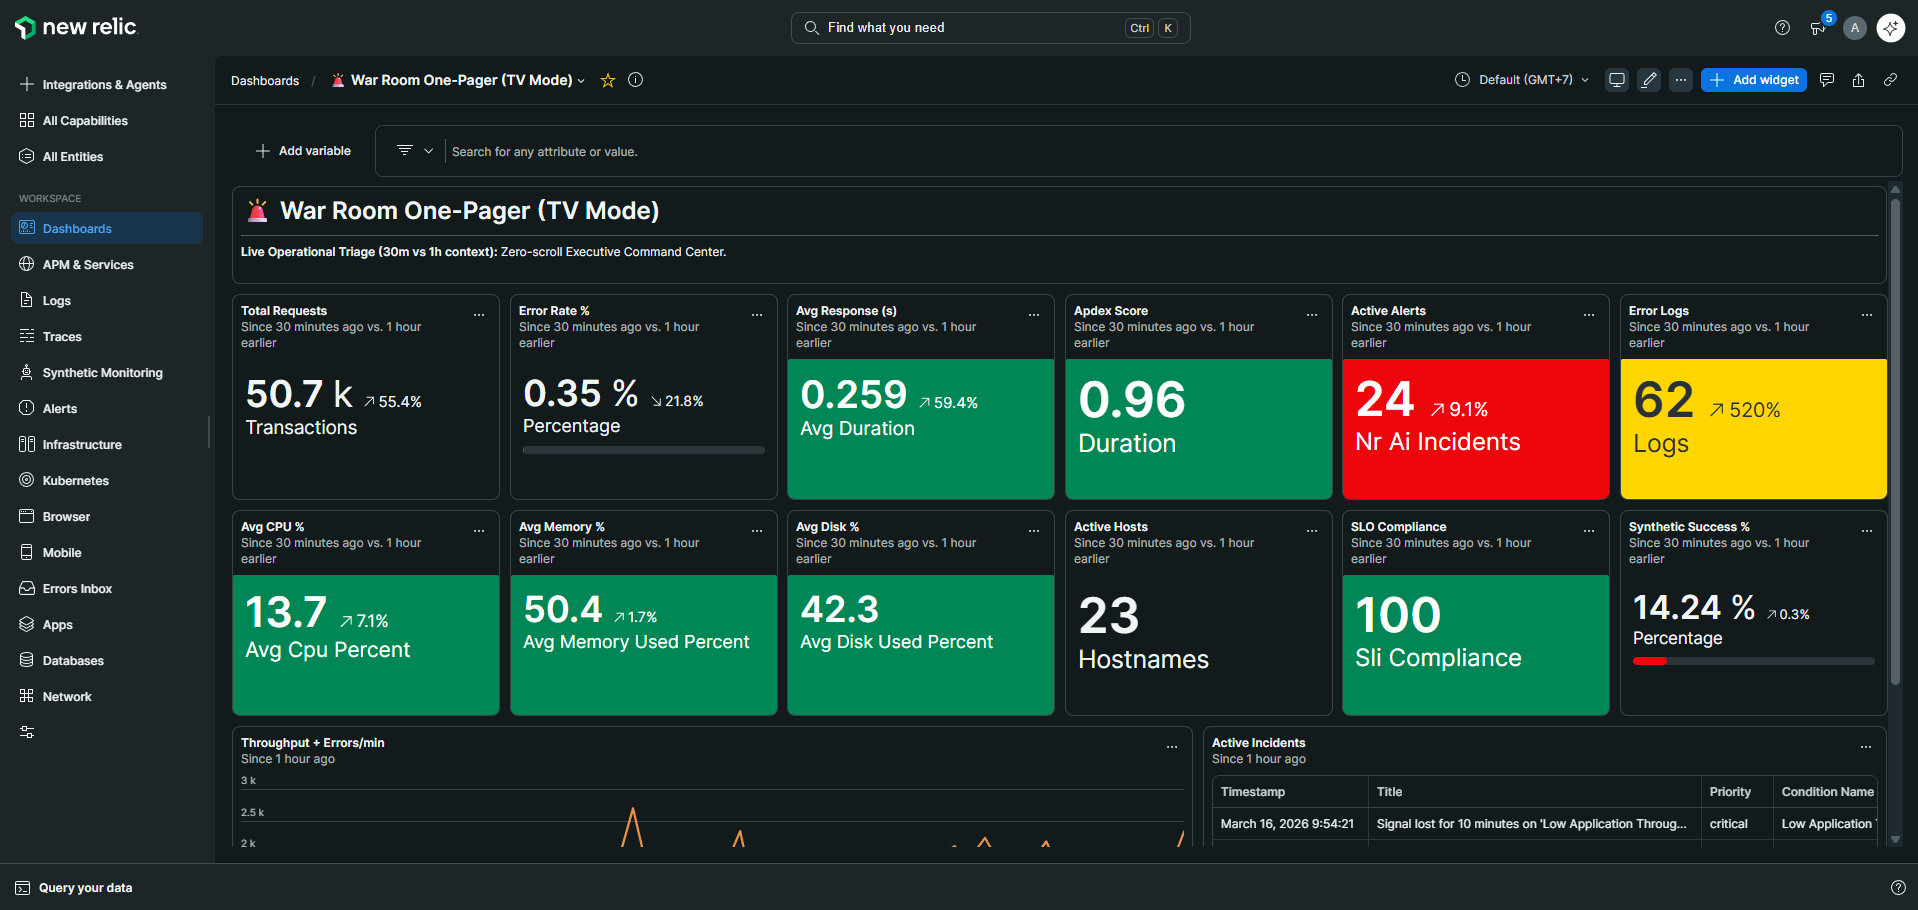
What I Built
I consolidated their observability stack end-to-end with New Relic, replacing fragmented tools with a single unified platform. I instrumented applications and infrastructure, designed dashboards tailored to each team's actual workflow, and tuned alerts to cut noise without missing what matters. Then I ran training sessions so engineers could use what we built, not just look at it. The goal was simple: when something breaks at 2am, the right person gets paged with enough context to act immediately.
Need this inside your team?
Bring me in to turn fragmented telemetry into an operating model.
I can own instrumentation, alert hygiene, dashboard design, and handoff for SRE or observability teams that need production signal they can trust.
Related
More case studies.
New Relic Observability Toolkit
Codified production observability into reusable Terraform modules so teams can deploy alerts, dashboards, and notifications consistently from day one.

Full Network Observability in Docker
Built a laptop-ready Docker lab that simulates SNMP and syslog traffic, so engineers can learn and validate network observability without physical hardware.